Energy
Load–Duration Curves
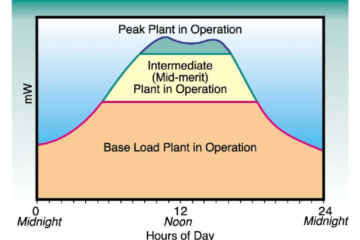
What is the load-duration curve? Figure 1. An example of weekly load fluctuations and roughly how power plants can be categorized as baseload, intermediate, or peaking plants. We can imagine a load–time curve, such as that shown in Fig. 1, as being a series of one-hour power demands arranged in Read more…